Thank you, Jim, for that kind introduction, and thank you to UC San Diego for hosting me.1 It is a pleasure to be speaking to this group that includes students, faculty, and business leaders. The topics I want to focus on today are relevant for all of us: How could rapid technological change affect our economy, and what could that mean for monetary policy?
I will start by discussing an earlier period of major technological advances and what lessons we might distill from it for the current juncture. Next, I will turn to what evidence we have regarding the adoption of artificial intelligence (AI).2 I will consider how widely these tools are being used, in which sectors, and what recent research tells us about their potential effects on productivity. Then, I will consider the implications of rapid technological change for the economy more broadly, including for aggregate supply and demand, for inflation, and for the labor market. Finally, I will discuss briefly my thinking about the economic outlook and monetary policy.
Productivity Puzzles: Then and Now
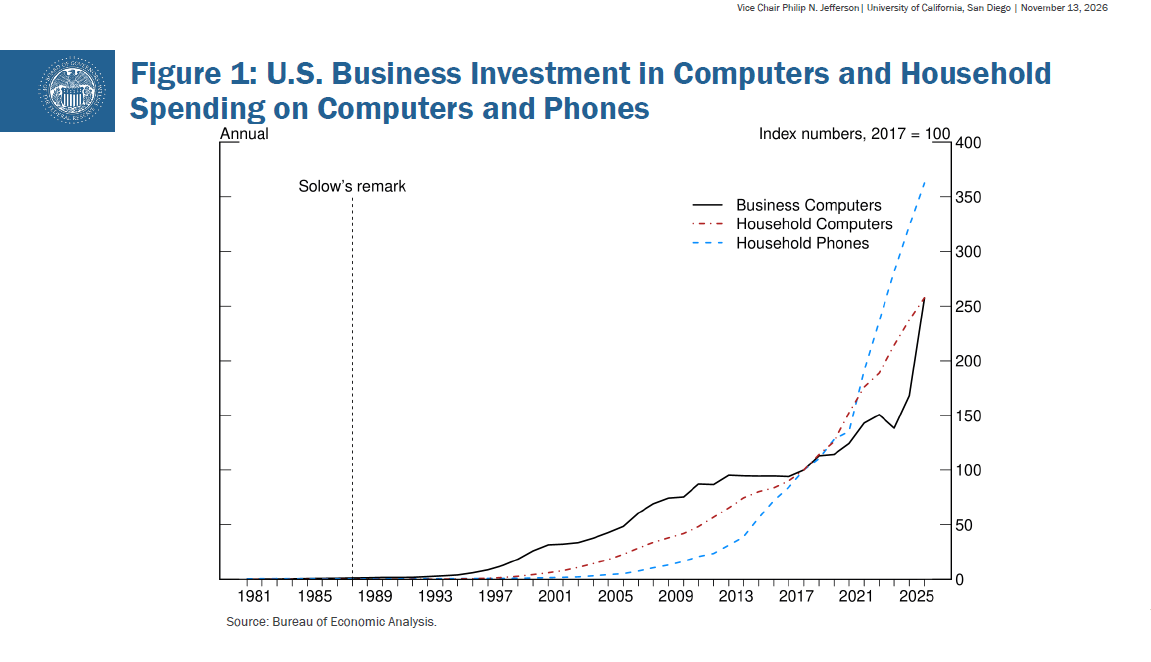
Nobel Prize-winning economist Robert Solow famously wrote in 1987 that “you can see the computer age everywhere but in the productivity statistics.”3 He may have been expecting too much from the computers he saw. While 32 percent of workers used computers at work in 1989, the computers were not very powerful. To illustrate, the processor in your phone today can do about as many calculations per second as 10 million 1987 vintage personal computers (PCs).4 In the aggregate, national spending on computers—shown in figure 1—was barely detectable at the time, despite PCs being an important part of the zeitgeist.5 Ten years later, computer investment had taken off and some observers, notably Chairman Greenspan, believed they could see it in the productivity statistics, though the link between the two was only established later.6 Investment in information technology (IT) capital—computers, software, and communications equipment—increased the annual growth rate of labor productivity about 3/4 percentage point in the late 1990s.7
While that expansion of the IT capital stock directly boosted worker productivity, there was more than that to the IT boom. Businesses also reorganized their operations around computers, which further supported productivity growth. Advancements in technology changed the cost of creating, storing, and communicating information and provided an opportunity for firms to rethink their scope, scale, and production functions.8 E-commerce, a wave of globalization, and software in the cloud eventually emerged from that process. One sign that reorganization was beneficial and significant was the rapid rise in the amount of output per unit of input outside the IT sector in the early 2000s. That productivity growth was not purely due to investing in more capital; instead, it also reflected increases in what economists call total factor productivity, or TFP.9
The seeds of the 1990s productivity boom were planted long before Solow’s observations in 1987. Basic research that laid the foundations for modern computing included the invention of the transistor in 1947 and the Fortran compiler in 1954. For decades, the applied research by firms that followed yielded practical applications for these advances, relentlessly improving information technology.
This pattern suggests a simple model of productivity growth. Basic research, conducted without a definite application in mind, expands our knowledge about the world. Applied research develops practical industrial applications, which increase productivity and drive down the cost of production. When costs decrease in those industries, prices tend to fall as well, especially in the presence of competition. Over time, firms intensify their use of lower-priced capital goods produced by higher productivity, a process known as “capital deepening.” Finally, firms using that capital rethink their approach to production, further increasing TFP and, perhaps, starting the investment cycle again. As the computing example illustrates, this process takes time for its full effect to be felt and measured, particularly for technologies that require business reorganization
It may be reasonable to apply this model to the development of AI. The generative models in focus today can be traced back to basic research that began soon after the transistor was invented.10 Practical applications emerged many years later. For example, the U.S. Postal Service began using AI to read hand-addressed envelopes in the 1990s.11 Usage took off, especially in the information and finance sectors, about 10 years later with the emergence of machine-learning models. Finally, after incredible improvements and training on massive data sets—all the text on the worldwide web, by some accounts—large language models are now good enough to support today’s popular chatbots, coding assistants, and smart devices as well as a host of less visible applications like scientific research.
Today’s world mirrors the one Bob Solow observed. The new technology seems to be everywhere: Generative AI dominates the news headlines, sits on our phones, and pops up in our software and customer service calls. It may have far-reaching implications for workers, firms, and government agencies, including central banks. But the old questions continue to haunt: How much are businesses and workers actually using it, and is that use affecting the productivity statistics? Now, I’ll review some preliminary evidence on these questions.
Paths of Adoption
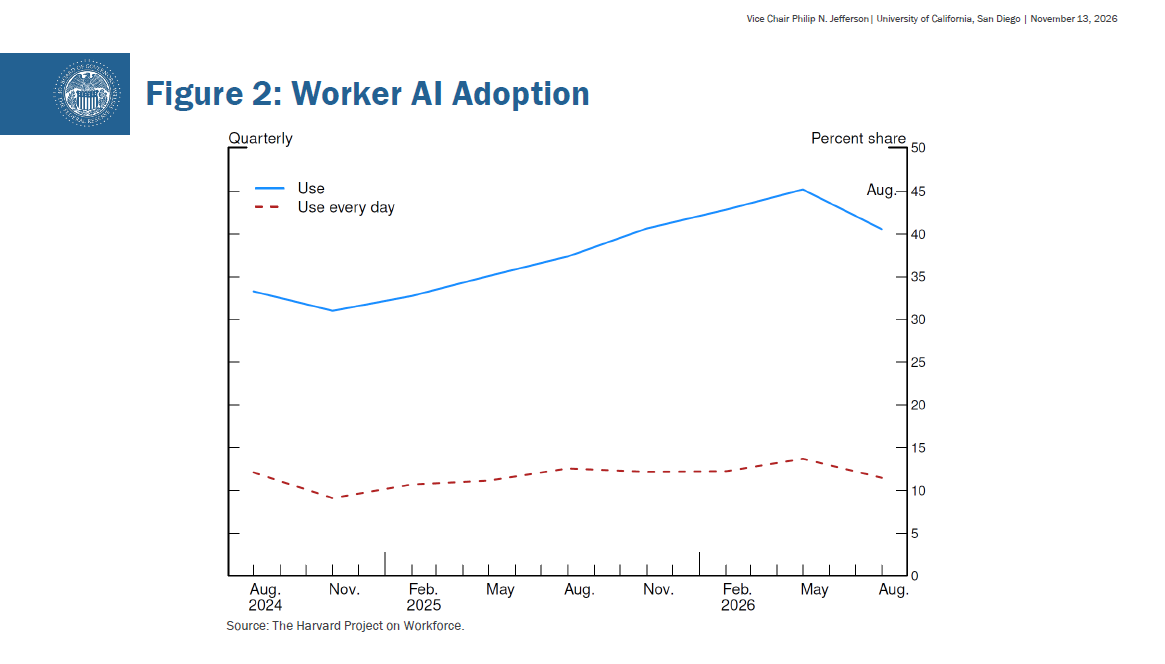
Recent surveys find that an appreciable and rising share of U.S. firms and workers are using generative AI. Surveys of workers have found that 40 to 50 percent of working adults are using the technology in their jobs, as shown by the blue line in figure 2.12 Among those workers who do use AI at work, however, only a modest fraction uses it every day, as the red dashed line shows.
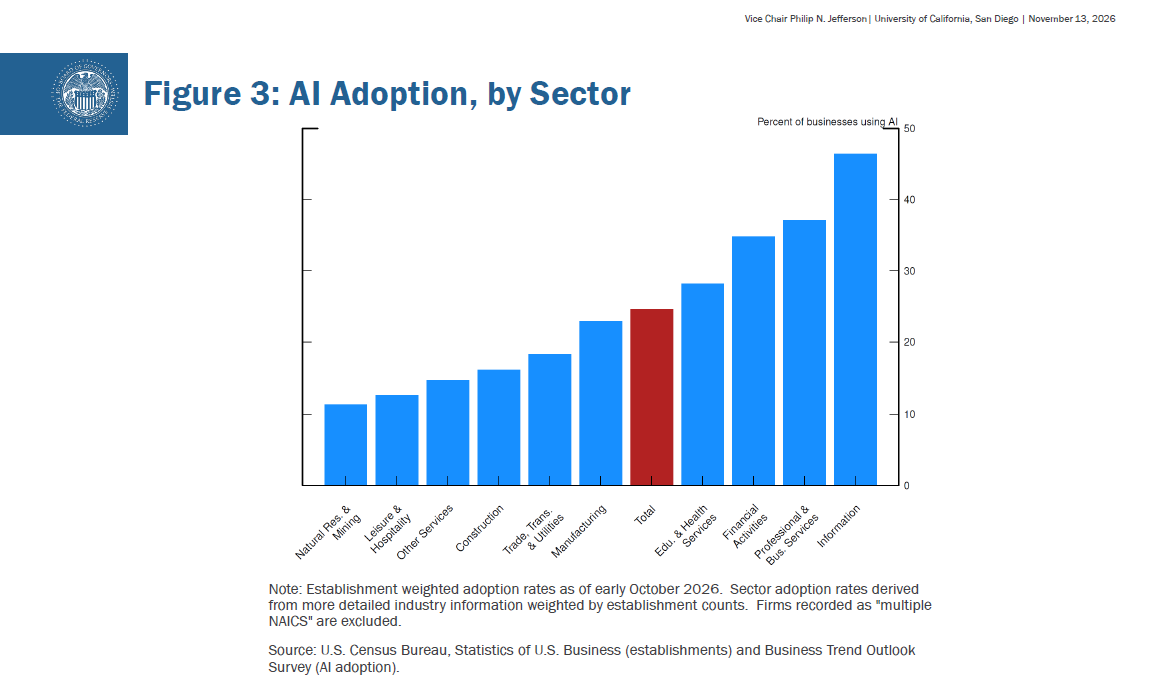
In addition, the adoption rate appears to vary widely across industries. While indicators of business adoption vary widely depending on methodology, the Census Bureau’s survey of a nationally representative sample of U.S. firms illustrates the cross-industry differences.13 As shown in figure 3, their survey indicates that, as of October 2026, roughly 25 percent of all U.S. firms, shown by the red bar, were using the technology in at least one business function as of the middle of this year. That share was closer to 40 percent in knowledge-intensive sectors such as professional services and information sectors. At the other end of the spectrum, it was around 10 percent for the mining and leisure and hospitality sectors.
Thus, compared with more mature technologies like the personal computer, AI is not truly everywhere—in the sense of being fully integrated into most firms’ and workers’ workflows across the economy. Rather, it appears that we are at an earlier stage that is a natural part of the long cycle of innovation and deployment. The new technology has shown its capability, and firms and workers are actively using it and exploring its possibilities, with some industries, firms, and occupations much farther ahead in this process than others.
Is the adoption we have seen thus far showing up in aggregate productivity statistics? Productivity growth has in fact moved up in recent years, but it’s too early to say what role AI played in that development. Productivity measures are so volatile that economists often look through quarterly or even annual swings by looking at long trailing averages. Labor productivity growth averaged 2.2 percent between 2020 and 2025, a welcome step up from the modest 1.5 percent average growth rate seen over the previous business cycle. However, this surge in productivity began before the debut of popular AI chatbots in 2022 and likely reflects a variety of factors, including a pickup in new business formation. Teasing out the contribution of AI to recent productivity growth is not straightforward. We’ll need to see more data. Retrospectively, research tied the 1990s productivity boom to IT, but we didn’t know that for sure in real time.
What about the microeconomic evidence? There is a growing body of evidence that the new technology is lifting efficiency directly and substantially for some specific tasks, particularly where it can most readily substitute for humans. For example, one influential academic study found that generative AI tools significantly improved the ability of some customer support employees to resolve issues.14
At the same time, the evidence about how task-level efficiency gains are affecting broader productivity appears mixed. On the one hand, some recent studies have found positive associations between productivity growth and adoption of or exposure to AI at the firm level.15 On the other hand, some surveys that attempt to measure causality more directly have found only modest effects so far. For example, one recent study surveyed senior managers and estimated that AI has boosted sales per employee by just 1/2 percent over the past three years.16
What could explain this apparent disconnect between task-level and firm-level gains? One likely reason is that, even among firms that use AI, the scope remains limited, as they are still experimenting and learning. One recent study found that among adopting firms, most are using AI in at most a few business functions, most commonly sales and marketing, strategy and business development, and information technology.17 Another possible explanation is that even for the most natural use cases, efficiency gains in one domain go hand-in-hand with offsetting costs, new demands, or bottlenecks elsewhere. For example, some firms report that AI-generated code contains more errors, so more debugging work is necessary.
That said, even if only a small minority of applications have delivered substantial productivity gains thus far, broader improvements may well materialize over time. Firms and workers will likely broaden and intensify their use of AI, as well as reorganize production and workflows. And successful firms could gain a competitive advantage, enabling them to expand and draw labor and capital away from competing firms.
All told, my judgement is that the evidence so far appears consistent with a contribution to aggregate productivity that is limited, but with the potential to grow quite substantially, broadly in line with historical episodes of technological breakthroughs. That said, the magnitude and timing of forthcoming productivity gains remain highly uncertain.
Implications for the Macroeconomy
What does all this mean for my thinking about macroeconomic activity? My baseline view is that adoption of new technology will ultimately lift the economy’s productive capacity substantially but gradually. Expectations of those longer-term gains on the supply side of the economy are already increasing aggregate demand significantly. A substantial portion of the rise in equity prices over the past few years can be attributed to enthusiasm around the new technology. That added wealth appears to be raising household spending. Firms are building and equipping new data centers on a very large scale to support model training and inference, driving rapid growth in aggregate business investment.18 This spending is putting upward pressure on resource utilization and the general price level. In addition, because investment demand is concentrated in some sectors where supply has struggled to keep pace, such as memory and logic chips, it has also contributed to steep increases in prices of specific goods. Over the medium term, the supply of these goods should catch up, and the broader boost to aggregate productivity from adoption should materialize.19 Both of those developments should ease the upward pressure on prices we see today.
While the new technology should ultimately generate higher output and income in the aggregate, I recognize that this transition could be painful for some workers and businesses. Firms that lag in adoption could be at a competitive disadvantage, and their long-term viability could be at risk. And even at firms that successfully adopt the technology, workers who specialize in tasks that AI can perform more efficiently—such as certain aspects of software development—may face job displacement.
One risk to my baseline outlook is that the new technology could displace workers much faster than they can adapt and retrain, which could result in an increase in unemployment. In this scenario, a key question for monetary policy would be how much of this increase is structural—reflecting a persistent mismatch between worker skills and firms’ needs—and therefore likely to persist even when the economy is operating close to its full potential. Monetary policy can affect cyclical conditions, like a temporary downturn in employment and spending, but it cannot address the structural factors that determine long-run rates of employment.
As a monetary policymaker, I must also consider the potential effects of the new technology on the longer-run neutral rate of interest, often called r*. If the neutral rate rises, then for any given level of the federal funds rate, policy effectively becomes more accommodative. Conversely, if the neutral rate declines, then policy effectively becomes more restrictive. If the new technology leads to permanently higher levels of productivity growth, it may increase firms’ desire to invest and, hence, their demand for funding, raising the level of interest rates. As I discussed earlier, higher productivity growth may also discourage household savings and raise consumption by increasing expected future income. Under these circumstances, to reconcile the increase in investment with reduced savings, the neutral rate would likely rise. However, predicting changes in the neutral rate of interest is challenging, given the historically noisy relationship between productivity growth and real interest rates. Policymakers must remain attentive to real-time developments and potential future developments to ensure that the stance of monetary policy remains appropriately calibrated.
Economic Outlook
While the rapid pace of technological change has understandably captured the public’s attention, as a monetary policymaker my charge is to consider the broader economy, and not just a single sector. Therefore, I will use the last portion of my talk to discuss my current economic outlook for the U.S. and the stance of monetary policy.
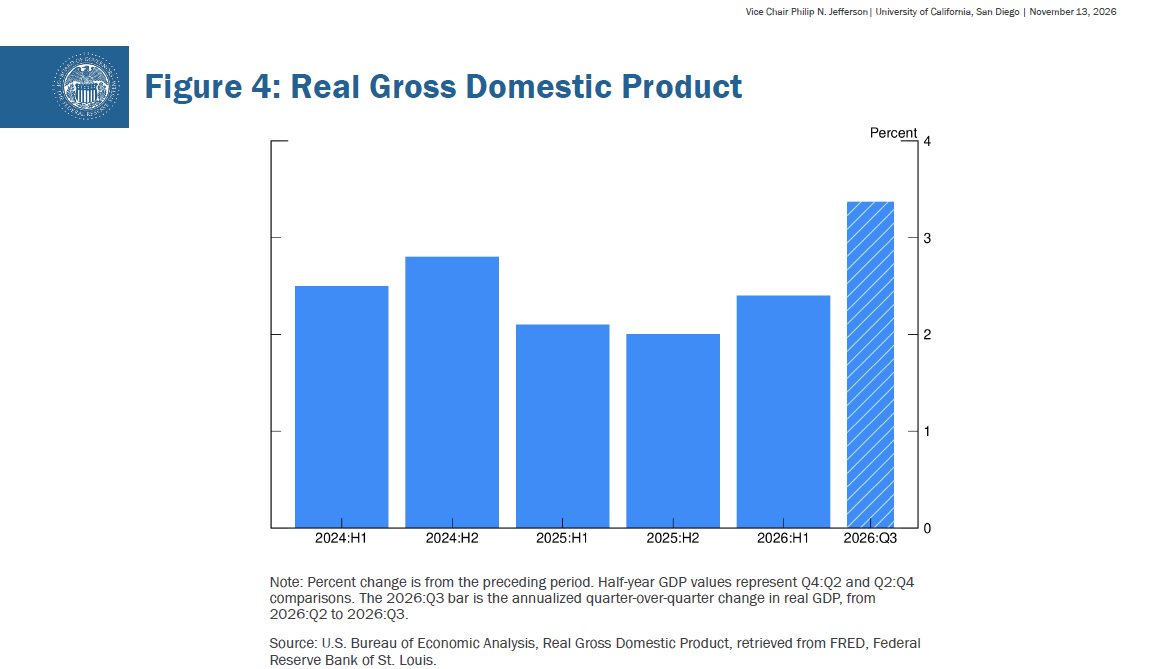
The economy has gained momentum this year, expanding at a pace roughly in line with its potential. That consistent growth is notable because the economy has faced a cascade of shocks, including an energy shock, and significant changes in trade policy, in addition to the technology buildout. As you can see in figure 4, GDP expanded at a 3.4 percent pace in the third quarter. Business investment has been quite strong. Consumer spending has remained resilient. I expect the expansion will continue roughly in line with potential output next year.
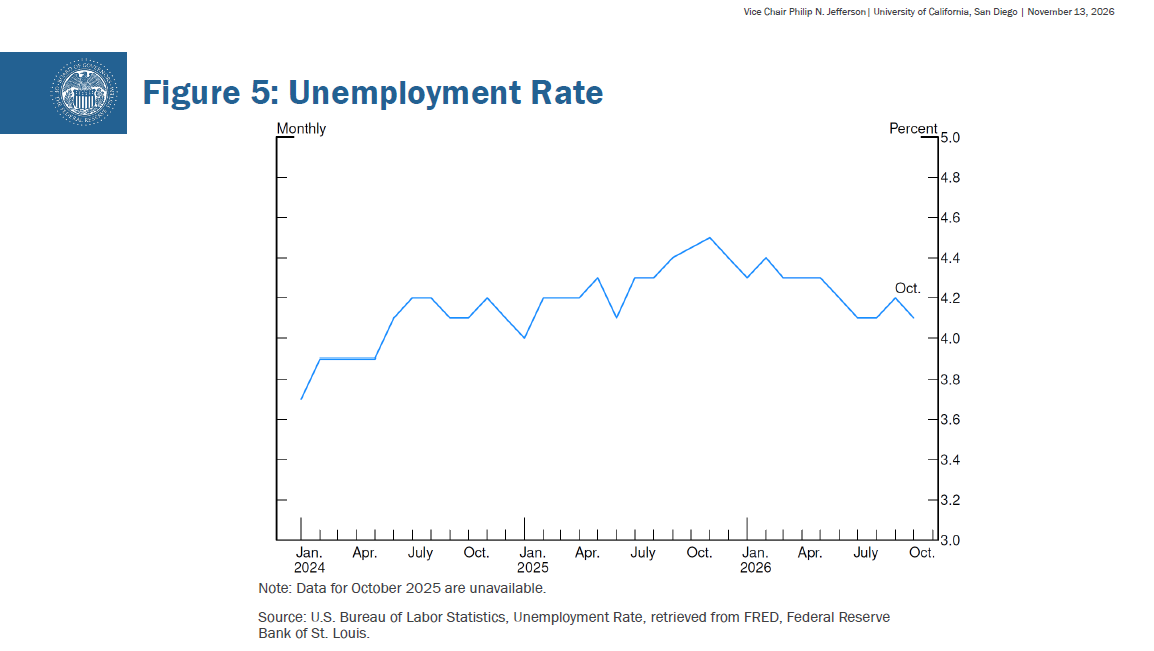
A broad range of recent data from the labor market shows conditions have stabilized. Figure 5 shows that the unemployment rate has largely moved sideways this year, settling at 4.1 percent in October. Layoffs remain low, and job openings have moved a bit higher. While job creation has been volatile, payroll gains have broadened to many sectors in recent months, which I find encouraging. I expect the unemployment rate to stay around its current level in the near term—a level I view as consistent with maximum employment. The risks to my economic output and employment forecasts are roughly balanced. An increase in uncertainty tied to Middle East tensions may weigh on activity and hiring, while a further surge in investment spending could support stronger growth.
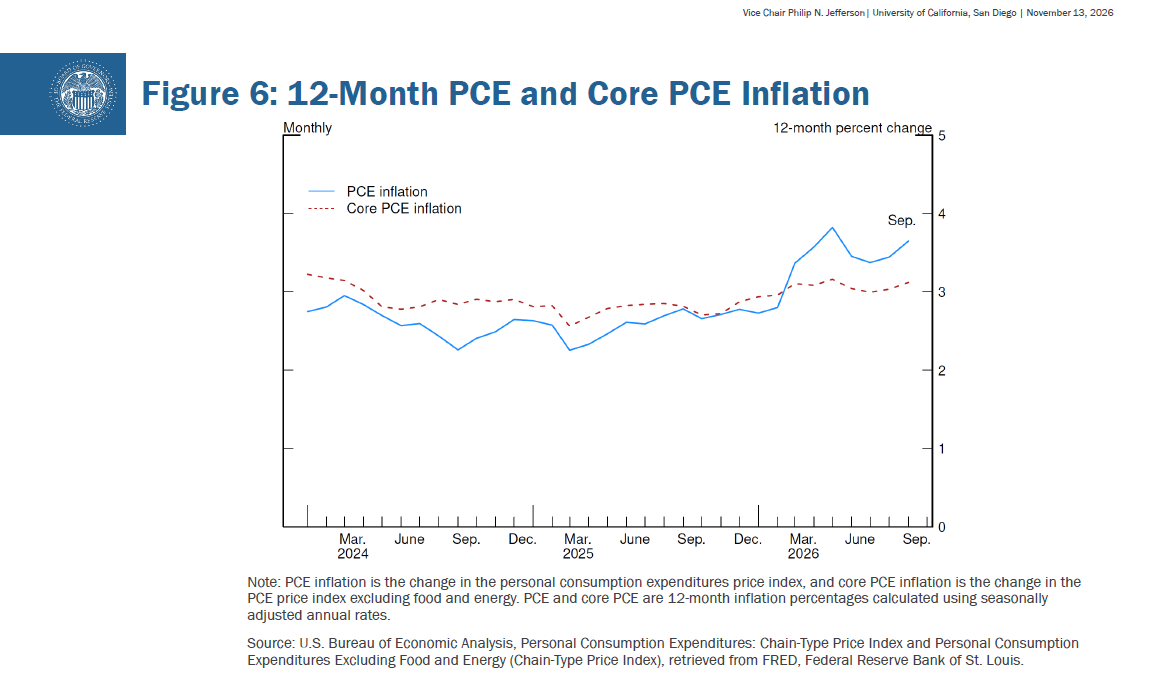
Turning to the price-stability side of our dual mandate, inflation remains notably above the Federal Open Market Committee’s (FOMC) 2 percent target. The 12-month change in the personal consumption expenditures price index, the blue line in figure 6, was 3.6 percent in September. Higher energy costs are one of the drivers of elevated inflation. Oil prices have been quite volatile, and global energy supplies have come under renewed strain, reflecting heightened geopolitical tensions. I remain concerned about the risk of higher energy prices leading to a persistent rise in inflation more broadly. The 12-month change in core PCE inflation, which excludes volatile food and energy prices and is shown by the dashed red dashed line, was 3.1 percent in September. Indirectly, higher energy costs are showing through in certain areas including airfares and transportation, and the boom in demand for new technologies has been driving unusually strong cost increases for consumer goods and services that depend on the same inputs, like memory. Data received so far for October remains consistent with well above-target inflation.
I am also paying close attention to inflation expectations. Survey-based, short-term measures of inflation expectations are elevated, mainly reflecting higher energy prices. Most measures of longer-term inflation expectations, however, have remained stable at levels consistent with 2 percent inflation.
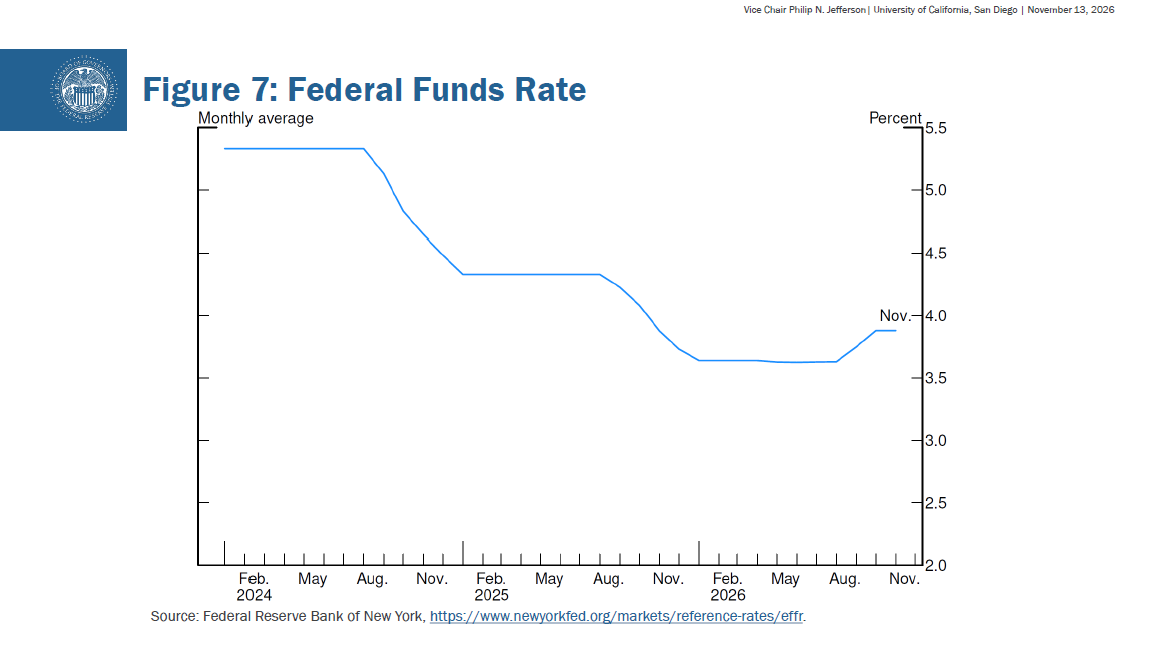
At the FOMC policy meeting last month, I joined the majority of my colleagues in voting to hold the federal funds rate steady, as shown in figure 7. Data received since that meeting have been consistent with economic activity and labor market conditions remaining broadly solid, while inflation readings show persistent price pressures. Accordingly, I see the trajectory of inflation as providing the more important signal for determining the appropriate stance of monetary policy. Going forward, I believe that further policy adjustments should be determined by carefully examining trends in the data, the evolving outlook, and the balance of risks.
Conclusion
In conclusion, I will leave you with this thought: New technologies cause us to revisit old but very important questions. The paths from innovation to adoption and adaptation to durable productivity gains can be uneven and unpredictable. Some would even say, puzzling.
New technologies command our attention long before they affect measured productivity. They cause us to rethink our understanding of how the economy works. Re-understanding our economy makes the process of monetary policymaking exciting and challenging. Thankfully, through it all, our mission at the Fed is clear. Deliver on the dual mandate given to us by Congress: maximum employment and price stability. These are the goals of every action we take.
Thank you for your time today.
1. The views expressed here are my own and are not necessarily those of my colleagues on the Federal Reserve Board or the Federal Open Market Committee. Return to text
2. Recent technological advancements discussed in this speech are sometimes referred to as super intelligence or SI. Return to text
3. Robert Solow (1987), “We’d Better Watch Out,” New York Times, July 12. Return to text
4. The Intel 386 microprocessor, a high-end option for PCs at the time, performed about 200,000 floating point operations per second (FLOPS). See Richard Grehan, Tom Thompson, Curtis Franklin Jr., and George A. Stewart (1988), “Introducing the New BYTE Benchmarks,” BYTE, June. The Apple A19 chip, used in the iPhone 17, performs 2.07 trillion FLOPS (see Nanoreview.net (2026), “Apple iPhone 17: Specifications and Benchmarks,” webpage, https://nanoreview.net/en/phone/apple-iphone-17. Return to text
5. The small share of computers in the capital stock was noted as a resolution of the paradox at the time. See Stephen D. Oliner, Daniel E. Sichel, Jack E. Triplett, and Robert J. Gordon (1994), “Computers and Output Growth Revisited: How Big is the Puzzle?” Brookings Papers on Economic Activity, no. 2, pp. 273–334. Return to text
6. See Alan Greenspan (1998), “The Implications of Technological Changes,” speech delivered at the Charlotte Chamber of Commerce, Charlotte, N.C., July 10. For evidence that the step-up in productivity and information technology were linked, see Stephen D. Oliner and Daniel E. Sichel (2000), “The Resurgence of Growth in the Late 1990s: Is Information Technology the Story?” Journal of Economic Perspectives, vol. 14 (4), pp. 3–22. Return to text
7. Daniel E. Sichel, Stephen Oliner, and Kevin J. Stiroh (2007), “Explaining a Productive Decade,” Brookings Papers on Economic Activity, Spring, pp. 81–152. Return to text
8. See the discussion in Timothy F. Bresnahan, Erik Brynjolfsson, and Lorin M. Hitt (2002), “Information Technology, Workplace Organization, and the Demand for Skilled Labor: Firm-Level Evidence,” The Quarterly Journal of Economics, vol. 117 (1), pp. 339–76. Return to text
9. Sichel, Oliner, Stiroh “Explaining a Productive Decade” (see note 7) Return to text
10. James Moor (2006), “The Dartmouth College Artificial Intelligence Conference: The Next Fifty Years,” AI Magazine, December 15, pp. 87–91. Return to text
11. See Brian Tanton (2007), “Becoming More Clear,” Mailing Systems Technology, January 29. Return to text
12. See Alexander Bick, Adam Blandin, David J. Deming, and Tyler R. Schumacher (2026), “What Work Does Generative AI Do?” NBER Working Paper Series 35677 (Cambridge, Mass.: National Bureau of Economic Research, August). Return to text
13. For example, since large firms account for a disproportionate share of total employment, adoption rates that are weighted by employment are even higher than the Census figures discussed here. For example, see Ivan Yotzov, Jose Maria Barrero, Nicholas Bloom, Philip Bunn, Chanya Chawla, Steven J. Davis, Kevin M. Foster, Aaron Jalca, Brent H. Meyer, Paul Mizen, Michael A. Navarrete, Samil Oh, Katia Garcia Loredo, Monique Reid, Pawel Smietanka, Gregory Thwaites, and Ben Zhe Wang (2026), “Firm Data on AI,” NBER Working Paper Series 34836 (Cambridge, Mass.: National Bureau of Economic Research, February; revised October 2026). This paper finds that the employment-weighted adoption rate among U.S. firms is 95 percent. Return to text
14. See Erik Brynjolfsson, Danielle Li, and Lindsey Raymond (2025), “Generative AI at Work,” The Quarterly Journal of Economics, vol. 140 (2), pp. 889–942. Return to text
15. For example, see Tania Babina, Alex X. He, and Renhao Jiang (2026), “Canaries in the Gold Mine: Early Productivity Gains from Artificial Intelligence Creating Organization Capital,” NBER Working Paper Series 35684 (Cambridge, Mass.: National Bureau of Economic Research, August). Return to text
16. See Ivan Yotzov et al. (2026), “Firm Data on AI” (see note 13). This estimate is an employment-weighted average over survey respondents. Return to text
17. Kathryn Bonney, Cory Breaux, Emin Dinlersoz, Lucia Foster, John Haltiwanger, and Aditya Pande (2026), “The Microstructure of AI Diffusion: Evidence from Firms, Business Functions, and Worker Tasks,” Center for Economic Studies Working Paper No. CES-26-25 (Washington: U.S. Census Bureau, April). Return to text
18. A substantial share of this investment demand, especially for IT equipment, is satisfied with imports, reducing the direct effect on GDP. That said, capital deepening raises labor productivity, whether the capital was imported or not. Return to text
19. In particular, memory chip manufacturers have announced a massive increase in production capacity, which will ease price pressure for products using DRAM in coming years. Return to text